Chapter 5 Chapter 5 Results
5.1 Adult Works
5.1.1 Proportion of Adult movies over time
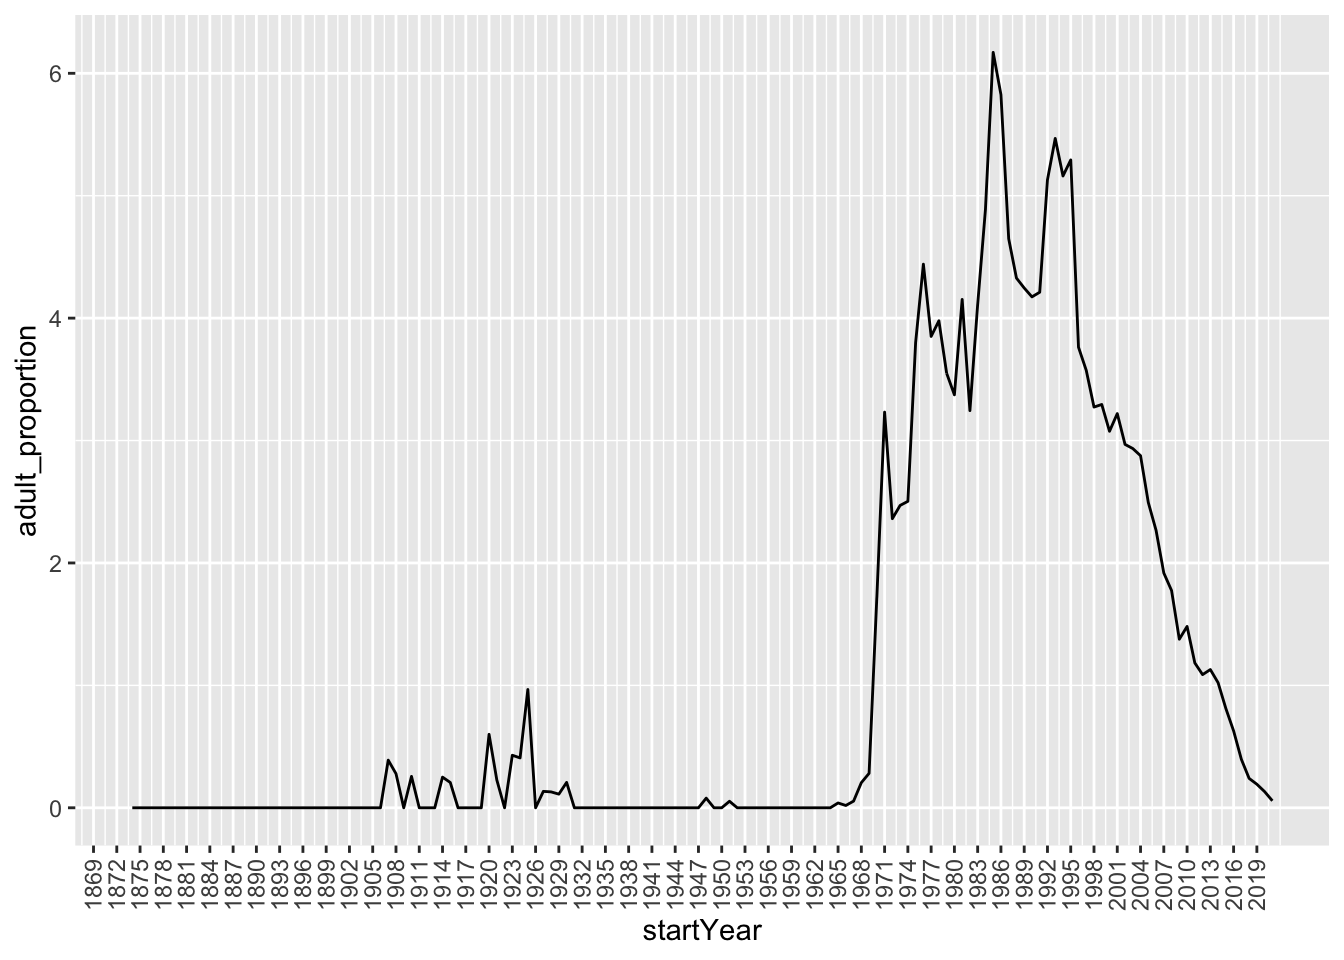 1. The graph above shows an interesting trend on the proportion of titles that were released and were adult with increasing year. In the late 1800s it was observed that no adult titles were released at all.
2. However, the trend changed in the early 1900s where the number of releases for adult titles started increasing. There were a few rising spikes observed in some of the years between 1905 to 1930; at for example, 1907, 1909, 1914, 1920, and 1924. The highest proportion achieved in the early 1900s was peaked at 1% of the total movie releases of the year 1924.
3. Further, this unstable rise in the proportion of releases of adult titles started declining constantly and immediately became 0% for year between 1930 and 1947. After a few very less proportionate spikes until 1968, the proportion of releases started increasing linearly till 1971 and peaked at ~3.3% in 1971.
4. After 1971, there was a considerable increased proportion of adult title releases in the late 1900s till 1995. However, this increase was quite abrupt as, that is, after decreasing for a year, the trend was witnessed to increase again and reach a new peak at ~4.5% in 1976. Next, after decreasing again for a few years till 1982, it again saw a significant increase till 1984 and reached its maximum peak over the given years at around 6.5%
5. Ultimately, the trend was cumulatively observed to decrease at approximately 0% in 2020.
The results overall demonstrates that with progressing years, the proportio of adult movies increased though abruptly.
5.1.2 Comparison of Adult vs Non-Adult movies
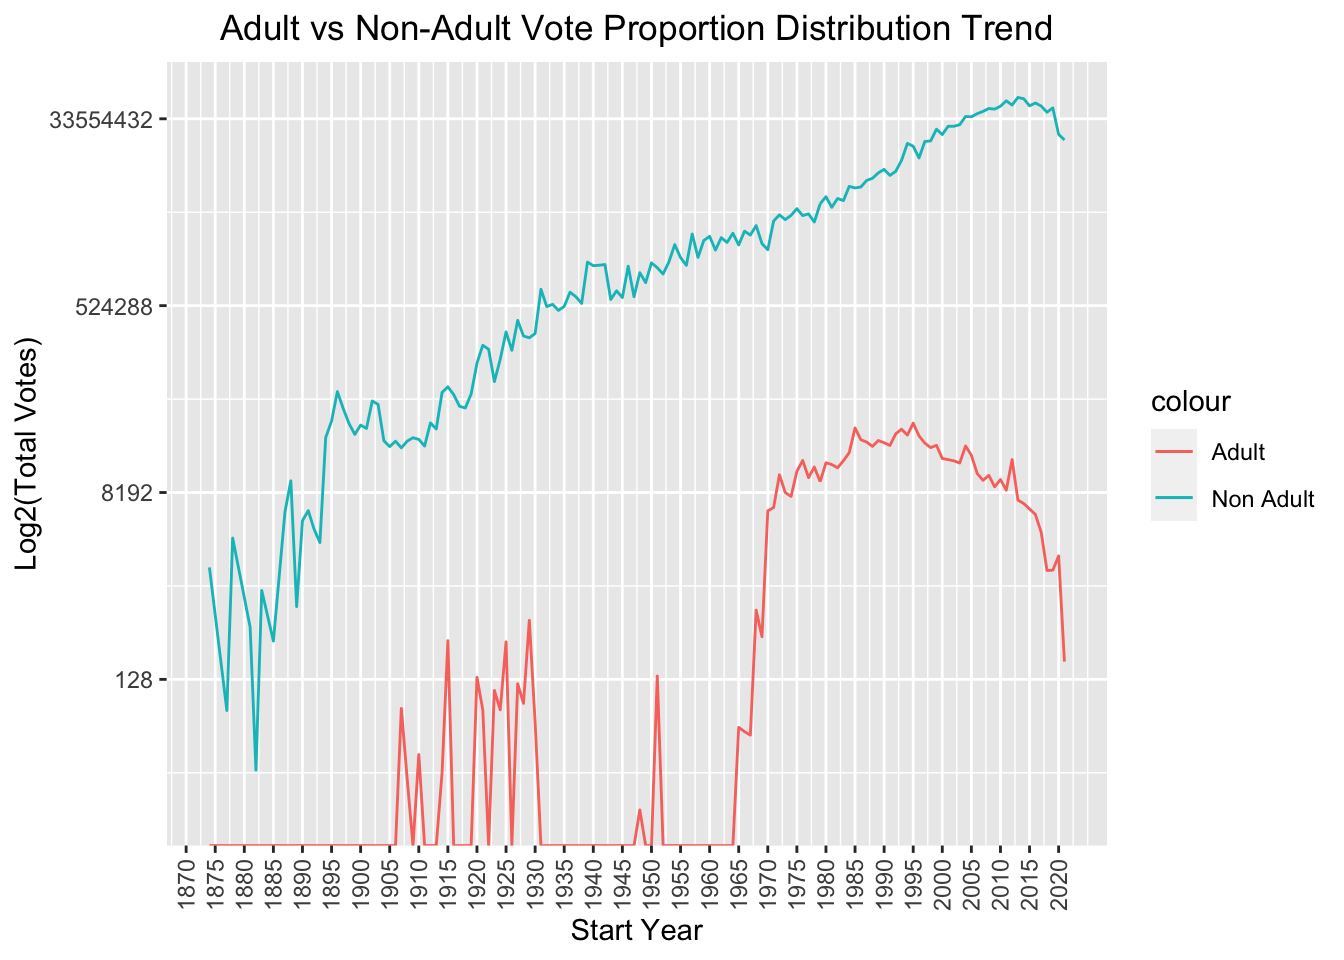
We have plotted the above graph to comparatively study the proportion of votes received by non adult and adult titles over the given period of time in the dataset.
Note that we have used the log() function to calculate and represent the number(proportion) of votes for adult and non adult titles. It is because both of the titles has received number of votes in very separate ranges. Thus, to scale them in a visualizable range we used the log function.
1. The trend for the number of votes received by the adult titles is observed clearly to be similar to the trend observed in the proportion of adult title releases over the same given period of time. That is, adult titles experienced abrupt rises in the number of votes in the early 1900s as compared to 0 number of votes in the late 1800s. In the early 1900s, the number of votes peaked at ~2150 in 1929.
2. Further, it experienced a considerable decrease in the number of votes it received to 0 till 1950 and rised till 128 in 1950.
3. Eventually, the number of votes that adult titles received started increasing very significantly and reached a peak at ~138,000 in 1995. After that, the trend was of a decreasing one till 2020.
4. Contrary to the adult titles, the non adult titles witnessed a clear cumulative increasing trend on the number of votes it received over the given period of time from 1875 till 2020. This linear increase was quite abrupt experiencing minimal declines in the number of votes over the years, however, the overall trend for the number of votes received by non adult titles was increasing.
5.The non adult titles touched a minimum number of votes in 1881 with only 64 number of votes but it was still more than the proportion of votes received by adult titles which was 0. Moreover, it is noteworthy that no adult titles were released around that period.
6. The non adult movies experienced a peak at ~33554432 proportion of votes in 2011 compared to only ~8192 proportion of votes for adult titles.
7. Moreover, the general trend studied for the weighted average rating distribution of adult titles versus non adult titles can interpreted as one where the proportion of votes for non adult titles was always more than the proportion of votes received by adult titles in any given year.
5.2 Variation of Average Ratings amongst genres
5.2.1 Comparing Genres with Weighted Ratings and Number of Works
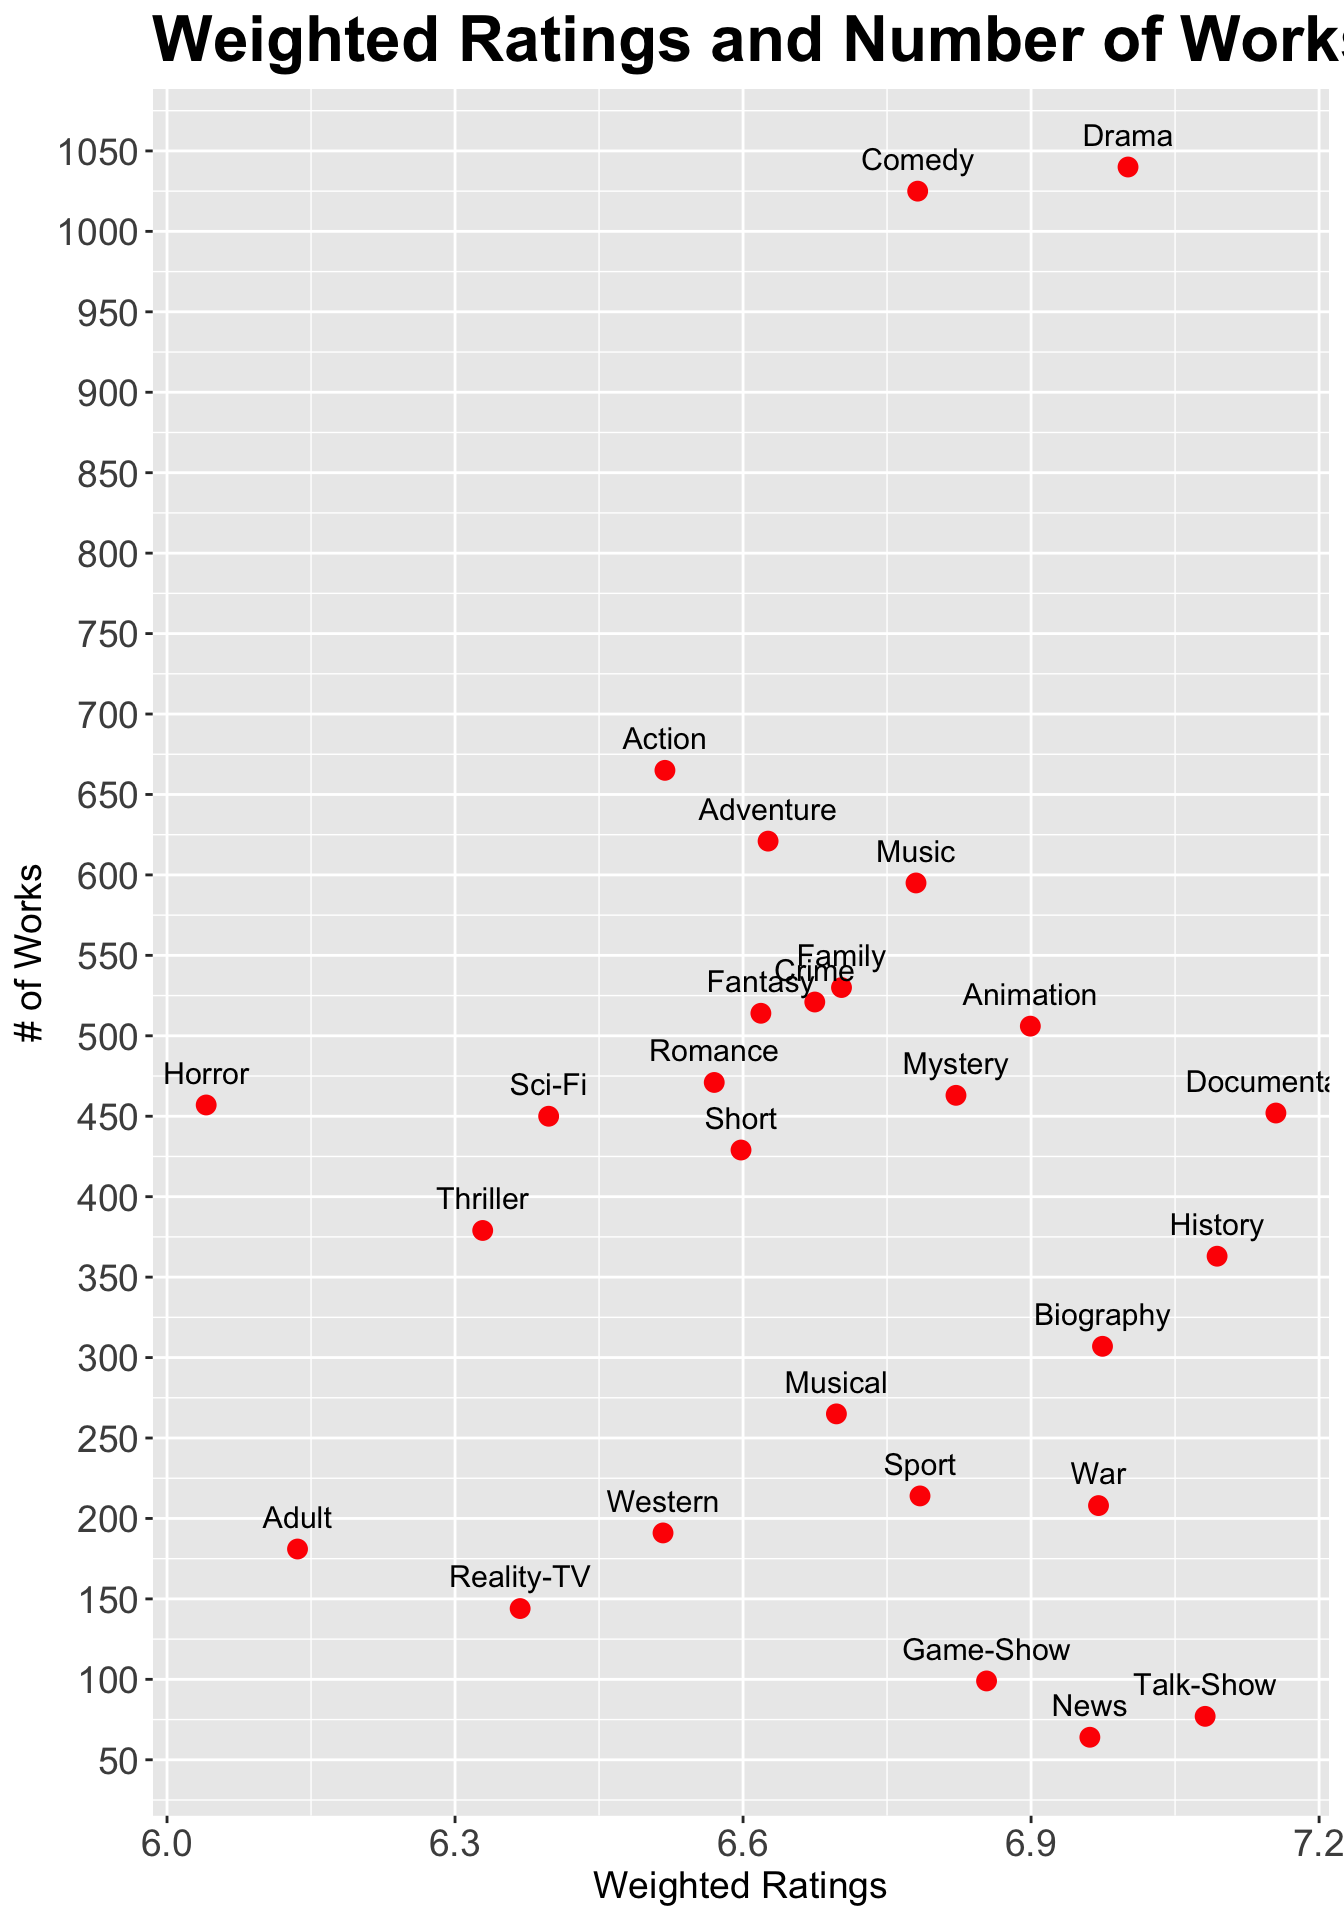
There is an interest in understanding which genres tend to perform better on IMDb ratings. Below we have plotted each genre based on the (i) number of works within that genre in the dataset and (ii) weighted ratings (weighted based on number of votes).
1. The weighted ratings range from 6.0 to 7.2.
2. There doesn’t seem to be a general trend in the data between weighted ratings and number of works.
3. Most of the genres lie below the 700 works line, and much are congregated specifically between the 350-700 works mark.
4. Based on the ‘Weighted Ratings and Number of Works per Genre’ scatterplot, we can see that the genre ‘Documentary’ has the highest weighted rating. ‘Horror’ has the lowest weighted rating which may be due to, given the relatively high number of works, overly-repetitive plot lines. ‘News’ has the lowest number of works.
5. We see that ‘Drama’ has the highest number of votes over all genres with a relatively high rating. This point is of particular interest to us.
6. ‘Drama’ (and ‘Comedy’) are both potential outliers. Based on this plot, ‘Drama’ is a genre that not only has the highest number of works but it also has one of the the highest weighted ratings.
It will be interesting to look deeper into the distribution within ‘Drama’.
5.2.2 Comparing Genres Across Different Title Types
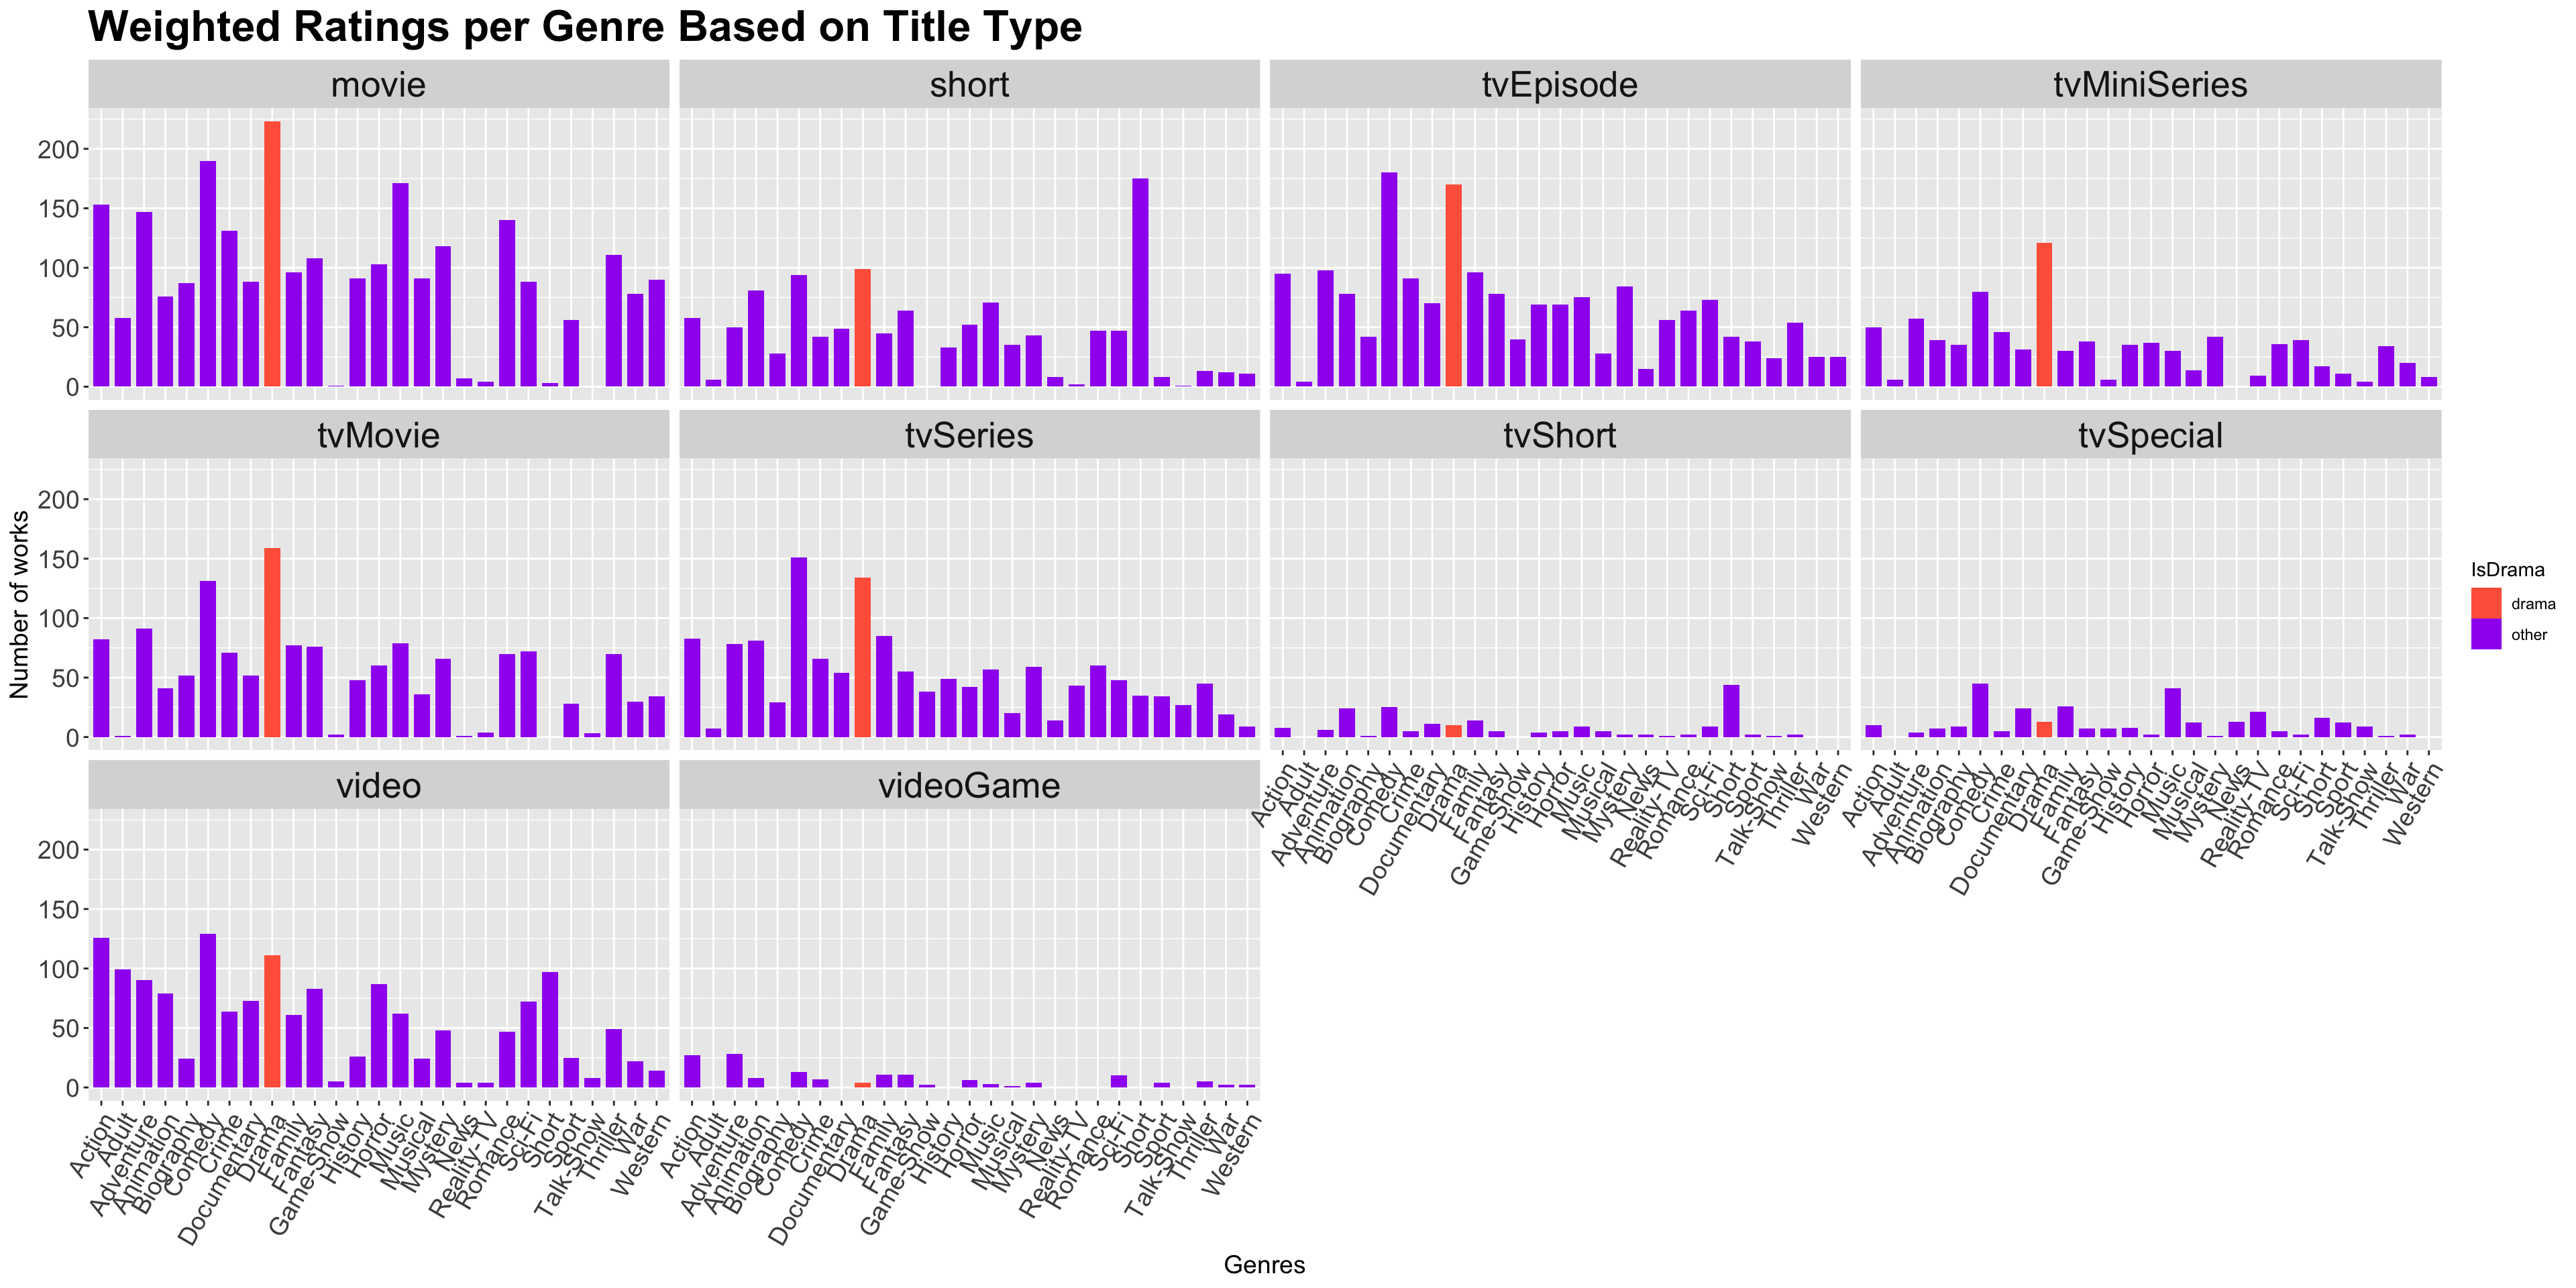
Using this faceted bar plot, we seek to compare the ‘Drama’ genre across different title types and between genres. Note that the ‘Drama’ genre column is highlighted for ease in comparison.
- The Movie and tvEpisode title types seem to pull the weight on the large quantity of titles in the full dataset. They typically have over 100 works for each genre in this cleaned dataset.
- The Game-Show genre has one of the lowest number of works in every single title type.
- Whereas tvShort and tvSpecial collectively have the least number of works in the dataset. They typically stay to below 100 works.
- It is evident that overall, the high number of works in the ‘Drama’ genre is not just due to one specific title type and that in almost all title types, the ‘Drama’ genre sticks out with competitive values.
- The ‘Short’ genre, for example, which expectedly has a high number of works in the short title type but overall lower in other title types. From the previous graph we know that the ‘Short’ genre has an average number of works and rating.
The above graph does not allow us to compare weighted ratings in the same way as the values are quite similar.
5.2.3 Deeper Dive - Comparing Different Genre Subtypes
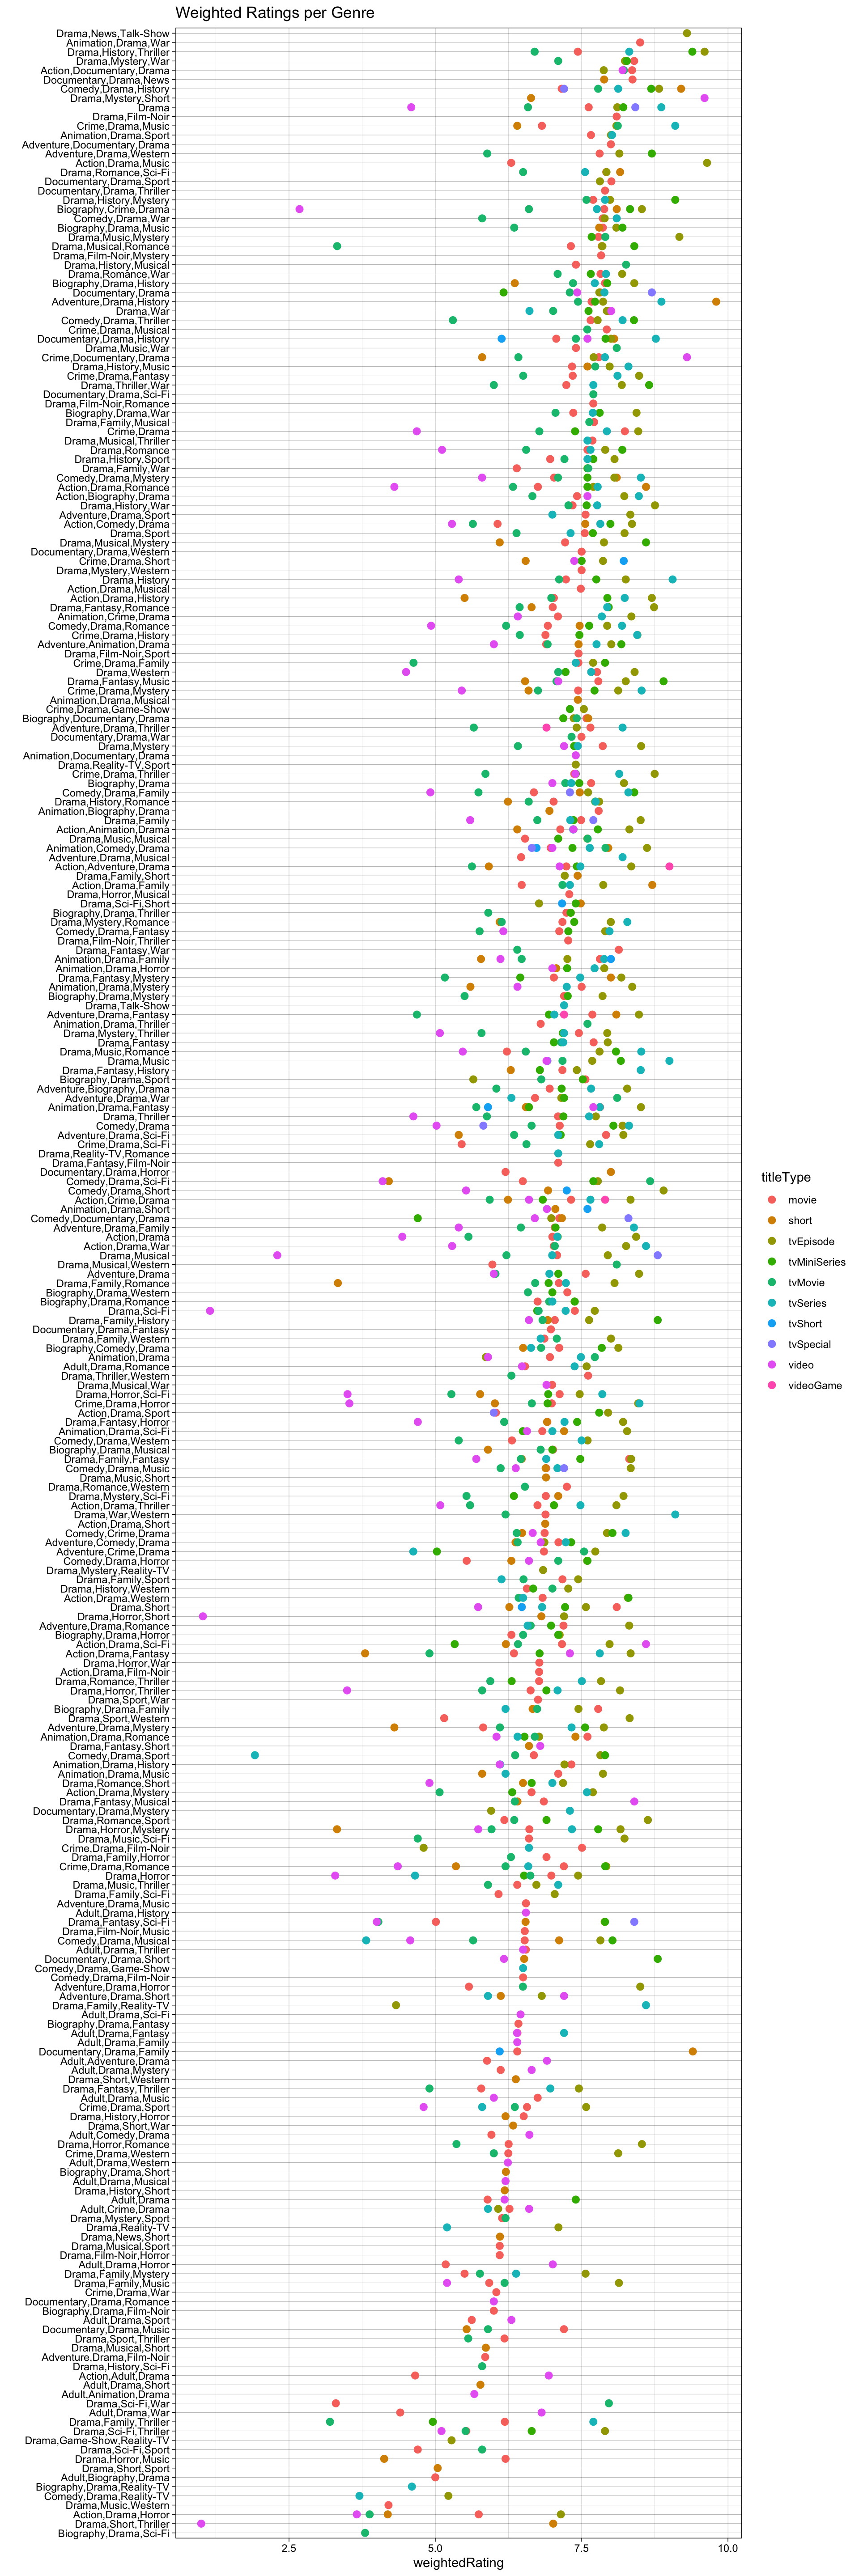
To compare the weighted ratings within the ‘Drama’ genre, we have made a cleveland dot plot colored by title type.
- The lowest rating is in the “Drama, Short, Thriller” category whereas the highest rating is in the ‘Biography, Drama, History’ category.
- Some genres like “Comedy, Drama, Sport” have very different ratings based on the title type but some like ‘Drama, News, Talk-show’ at the very top have either very few points (in this case causing the point to be at the very top as it is not pulled down by lower ratings during reordering) or have very similar ratings. However, if they have similar ratings, it is highly likely that the genre combo is not found in all title types.
- We primarily see that the videogame title type tends towards a lower weighted rating whereas tvEpisode and tvSeries tends towards a higher weighted rating. This may be because TV Series/Episodes in comparison to say movies have more time to tell stories and captivate the audience.
- Movie steadily tends to stay in the middle of all other title types for ratings.
- Looking deeper at the ‘Drama’ genres, we see more combinations with Thriller/Horror and Reality-TV at the bottom (lower weighted ratings) in comparison to Documentary or History at the top of the graph. Looking back at plot 5.2.1 we can wee that these other genres have overall lower or higher ratings respectively, especially given that they have similar amounts of work.
5.2.4 Comparing Title Types Based on Ratings and Total Votes
In order to look deeper into the distributions of title types. We have made a parallel coordinate diagram. Here we can interactively compare title types, genres, total votes for each distribution, and weighted averages. Each axis can be dragged to different locations, i.e. axis can switch places. Clicking and dragging in a certain area will select a set of points encompassed in the location which the mouse was dragged.
- The highest of the ratings seem to come from tv types, i.e.: “tvEpisode, tvMiniSeries, and tvSeries”.
- Most works congregate towards the lower end of the total votes category. By selecting the upper half of the total votes axis, we see that every one of the potential outliers in total votes come from the movie type.
- Movie works typically have weighted averages lying in the 6-8 range. Not single work within the Drama category seems to have a weighted rating above 9. This title type has the largest variance for number of votes.
- Short has a very low variance for total votes as all of the works are congregated towards the lower set of votes. There are some short works that have amazing ratings, however, most tend to stay between 6-8.
- There are very few works in the dataset for tvShort, tvSpecial, and videogame types. 6.. There is a subset of “Drama” combo genres for each title type that has no works, according to the dataset. However it is hard to distinguish the difference between these genre combos.
5.3 Best Director-Writer Pairings
5.3.1 Comparing best Director-Writer Pairs over work ratings
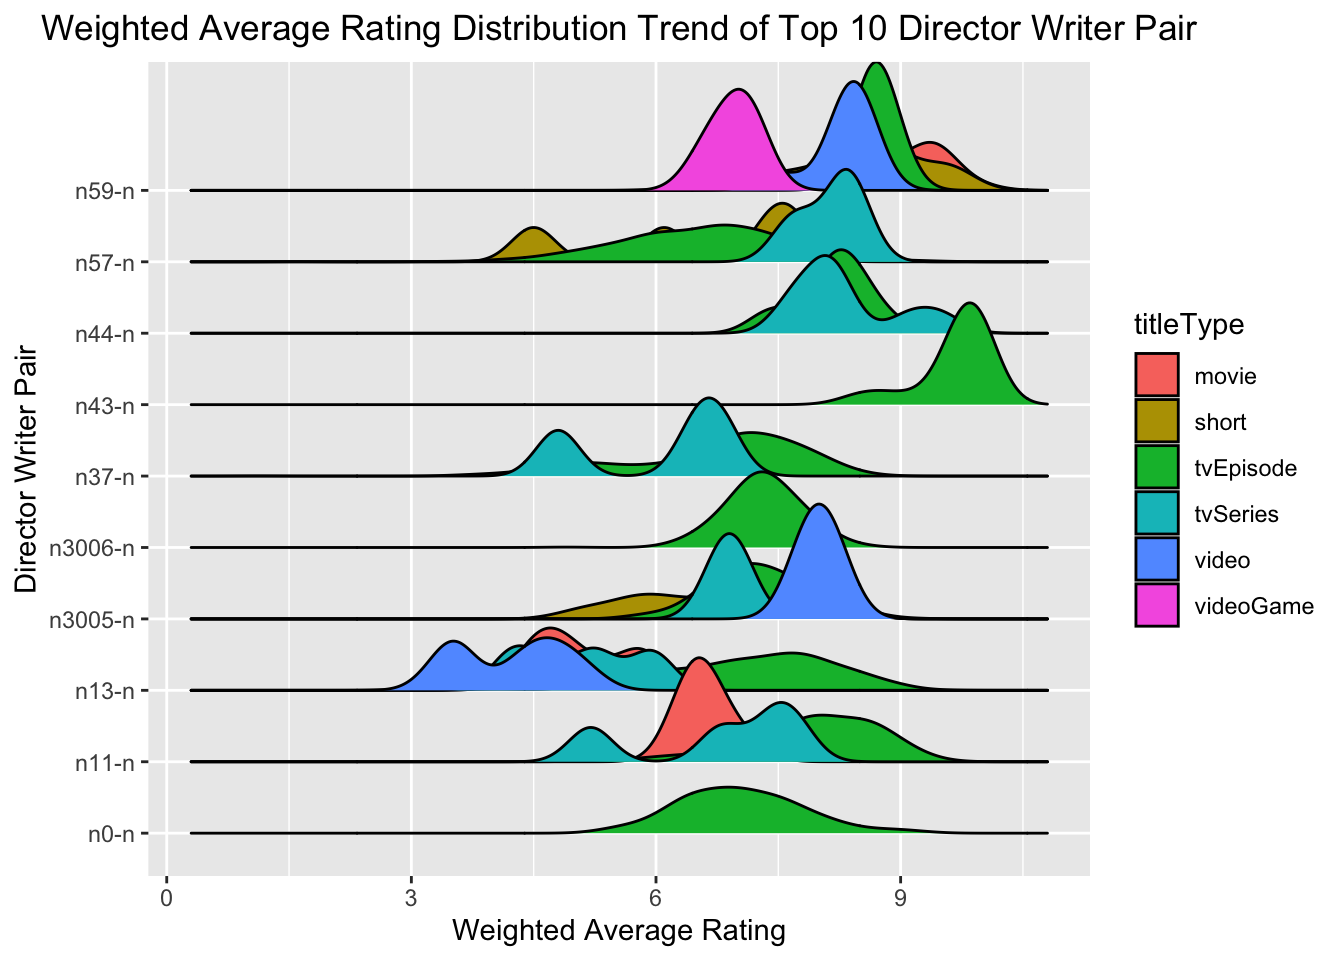
We have plotted the above graph to visualize the weighted average ratings distribution of top 10 pairs of director and writer that have worked together for the most of the times. For each director-writer pair, the individual ridges shows the spread of the weighted average ratings of different title types they have worked together.
The following are the basics results we interpret from the graph above:
1. The director-writer pair “n59-n” have worked together in shortMovie, Movie, tvEpisode, video and videoGame. Amongst all the title types, the pair has the highest weighted average rating for movies. The mean of the weighted average ratings for movies is approximately 9.2. This suggest that the movies of the pair “n59-n” are more liked by the audience.
2. The director-writer pair “n57-n” have worked together in shortMovie, tvEpisode, and tvSeries. The pair seems to be famous for its tvSeries as we can see that the distribution of the weighted average rating for tvSeries is spread towards the higher end compared to other title types and has the mean of around 7.5 ratings.
3. The pair “n44-n” is observed to make only tvSeries or tvEpisodes. Visualizing the graph we can say that the pair is more likely famous for tvSeries as their weighted average rating spread extends above 9.
4. Interestingly, the pair “n43-n” only produces tvEpisode having a mean rating of 9.5 that is the highest amongst all the top 10 pairs of director and writer. This suggest that the tvEpisodes of this pair are more liked by the people compared to the tvEpisodes released by other pairs.
5. The pair ”n37-n” has worked together for tvSeries and tvEpisodes. From the graph we interpret that the particular pair is more liked by audience when they work together for a tvEpisode.
6. The pair “n3006-n” is also seen to have worked together only for tvEpisodes. The mean of these tvEpisodes are nearly 6.8 ratings.
7. The pair “n3005-n” have worked together for different shortMovies, tvSeries, video and tvEpisodes. Amongst all the titleType, the pair is more liked by the audience for the video content that they release. The mean of their weighted average rating distribution is approximately 7.5 ratings.
8. The pair “n13-n” seems to have worked for titleType tvEpisode, video, tvSeries, and movie. Amongst all the titleType we can say that the pair is most famous for the tvEpisode. This pair is observed to produce the least liked video content compared to video content produced by other pairs.
9. The pair “n11-n” is noticed to have worked for tvEpisode, tvSeries, and movie types of contents. Amongst all the titleTypes this pair worked on, they are most rated for the tvEpisodes.
10. The pair “n0-n” have only worked together to create tvEpisodes. Moreover, the mean of their tvEpisodes is 6.6 ratings.
5.3.2 Which director-writer pairs had the most votes
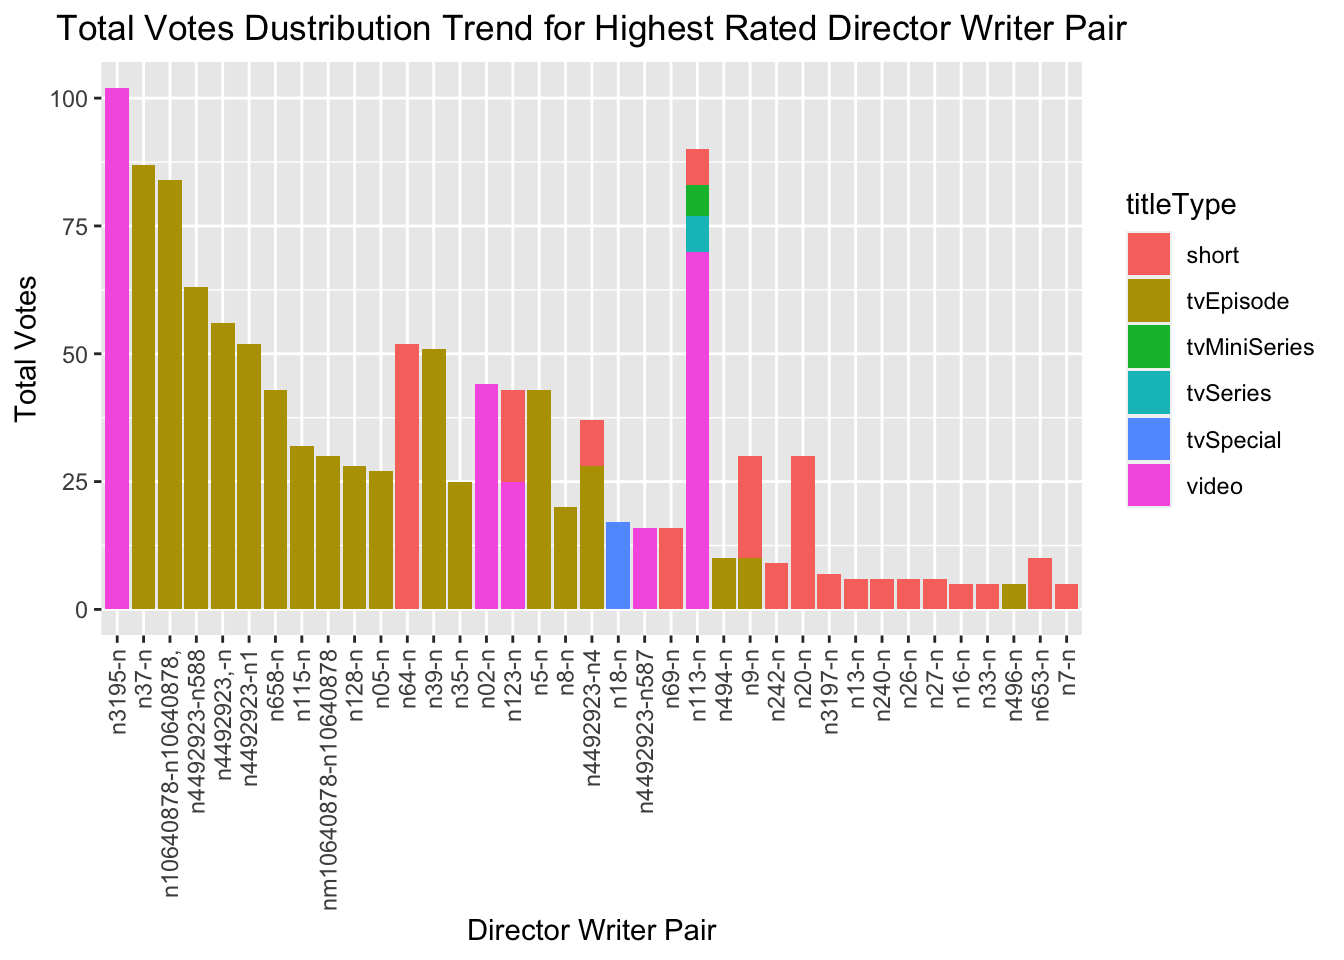
We have plotted the above graph to visualize the number of votes received for different title types released by each director writer pairs that have worked more than 5 times together and had produced contents of weighted average rating equal to 10.
1. For the titleType short we can see clearly that the pair “64-n” has the highest number of votes. Although, all the pairs have received the an average rating 10 but the most likely pair for the titleType short is “n64-n”.
2. For the titleType tvEpisode we observe that there are plenty of pairs that have worked together for this content type. Out of all the pairs, we observe that “n37-n” has the highest number of votes , that is approximately 87.5 votes. Moreover, the pair “n10640878-n10640878” also seem to have similar trend of likening among the audience.
3. Interestingly, among all the available pairs above, the only the pair that have worked together to release the titleTypes of tvMiniSeries and tvSeries is “n113-n”.
4. Similarly, for tvSpecial, we noticed that there is only 1 pair of director-writers who have worked more than 5 times and produced a 10 rated content of this titleType. This pair is “n18-n” and they have received around 20 number of votes.
6. For the titleType video there are 5 pairs of director-writer that have worked together more than 5 times and gained 10 ratings. Amongst all the pairs, the pair “n3195-n” has the highest number of Votes which is approximately 100.